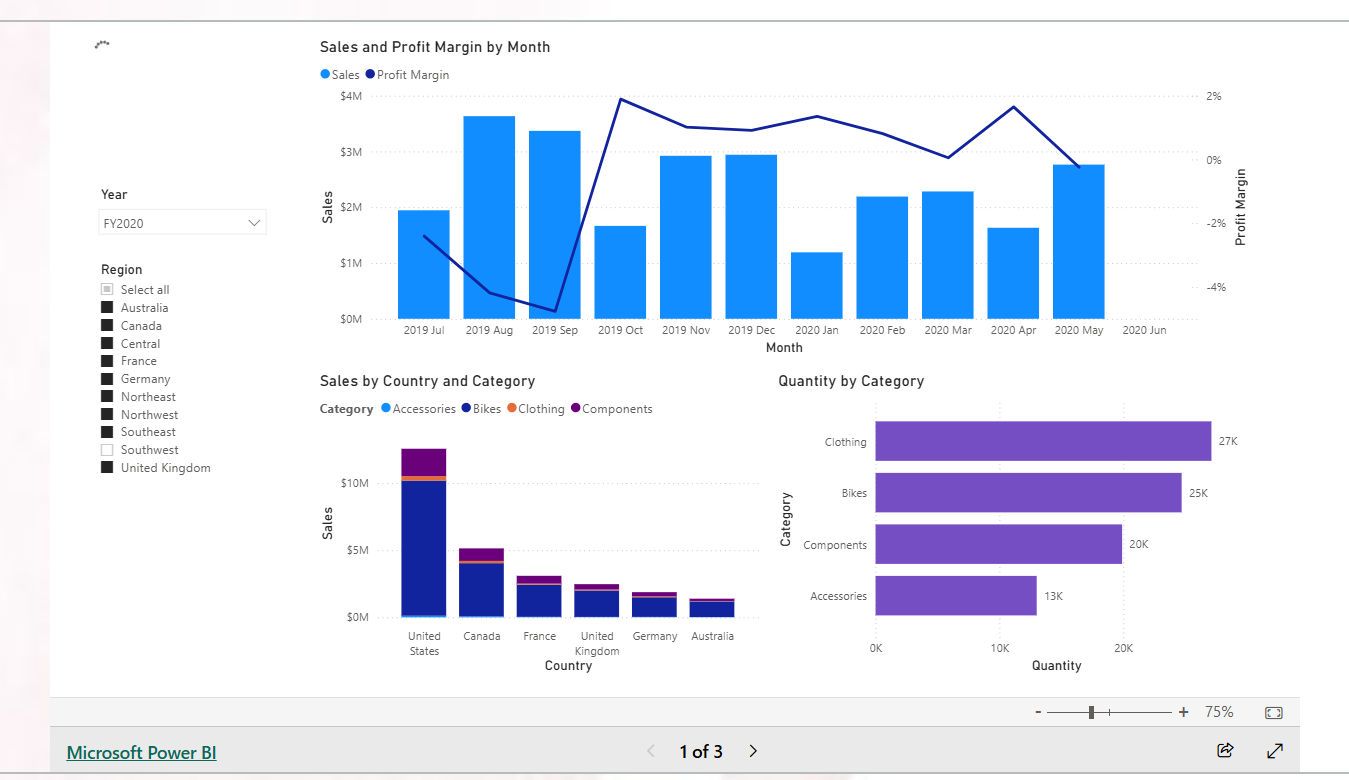
I’ve embedded this dashboard using Power BI’s “Publish to Web (Public)” feature, enabling seamless sharing of insights. To make this possible, I ensured the necessary configuration in the Admin Portal. As a Global Admin, I navigated to Admin Portal > Tenant Settings, where I enabled the option for users to create new embed codes. Additionally, I took full control of managing these codes through Admin Portal > Embed Codes, ensuring a secure and streamlined embedding process for my project.
In the future, this dashboard might become inaccessible due to potential changes in the server used for publishing, which is managed directly by Microsoft. The reason I opted to use an account provided by Microsoft is tied to the limitations of the free-tier Power BI service. Even with a trial subscription, I found that access to critical features, such as the Admin Panel, was restricted. By leveraging the Microsoft-provided account, I was able to fully utilize advanced capabilities, such as enabling tenant settings and managing embed codes, to ensure a seamless and professional user experience.
This decision reflects my commitment to overcoming technical limitations and delivering high-quality solutions, even when faced with platform constraints.
In this dashboard, I utilized Microsoft’s Adventure Works dataset as a primary source, querying data directly from a local SQL Server database. To enhance insights, I integrated an additional datasource—a CSV/Text file—for the Target table and Color Format, which I merged with the Product table to enable dynamic conditional formatting. The dashboard consists of three main pages:
- Overview of Sales: A high-level view of sales metrics.
- Profit Monitoring: Focused on tracking profitability trends.
- Performance by Salesperson: Dedicated to evaluating individual salesperson performance.
Additionally, I created four hidden pages specifically designed for drill-through functionality. These hidden pages allow users to explore deeper insights by right-clicking on the first page and selecting the drill-through option for category fields.
To enhance interactivity and user experience, I implemented several advanced Power BI features:
- Action Filters: Enabling seamless interactivity on the overview page.
- Drill-through: Allowing category-specific insights from the first page.
- Sync Slicers: Ensuring slicers remain consistent across all pages.
- Bookmarks: Optimizing the performance page for intuitive navigation
Beyond these features, I’ve also leveraged my broader expertise in Power BI to incorporate additional elements that make this dashboard even more impactful. I used tooltips to provide contextual details for visuals, ensuring users can access key insights without cluttering the interface. I enabled and customized analytics tools, such as trendlines and forecasts, to help visualize patterns and predict future outcomes. I also incorporated map visualizations, enabling them in both Power BI Desktop settings and the Power BI Admin Portal to ensure functionality after publishing.
In addition, I explored the use of community visualizations to add innovative and user-friendly custom visuals, further enhancing the dashboard’s interactivity. I even created a Python-based visualization by scripting directly within Power BI, demonstrating my ability to integrate advanced programming capabilities into my dashboards.
On the backend, I implemented robust data preparation and modeling in Power Query, including:
- Data Cleansing and Manipulation: Merging tables, unpivoting the Targets table, and more.
- Data Modeling: Creating many-to-many relationships for the Target table, building a Date table, and applying context filters using DAX.
This dashboard, which I’ve embedded into my web application, showcases the power of Power BI by blending interactive features with advanced backend configurations. It’s a perfect example of how I harness both analytical and technical skills to deliver actionable insights and an engaging user experience.
